Explainable Fault Diagnosis for Combustion Chamber Components Based on SHAP + Thermodynamic Simulation-Assisted Random Forest
Introduction
Today, I’m sharing a cutting-edge paper recently published in Measurement: "Thermodynamic Simulation-assisted Random Forest: Towards explainable fault diagnosis of combustion chamber components of marine diesel engines".
In the field of AI, we often face an awkward reality: a model might boast 99% accuracy, yet engineers hesitate to use it. Why? Because in safety-critical sectors like marine engine diagnostics, a "black-box" prediction isn't enough—we need explainability.
This paper demonstrates not only how to combine Thermodynamic Simulation with Random Forest(RF) but, more importantly, how to deeply apply the SHAP (Shapley Additive Explanations) algorithm. This provides a novel "X-ray" perspective for complex system diagnostics: it doesn't just locate the fault; it explains exactly which thermodynamic parameters are driving that conclusion.
Marginal Contribution
The core goal of SHAP is to answer: How much did each feature contribute to the final prediction? In fault diagnosis, this means identifying which thermodynamic parameter led the model to flag a specific fault.
Standard diagnostics usually end once the model outputs a result. However, this explainable approach "deconstructs" the logic backward.
Using Random Forest as an example: the forest consists of many decision trees. Each tree votes for a fault category, and the majority vote wins.
When data is fed into the model, the prediction score for fault equals the number of trees voting for that category. This score is determined by a set of parameters (all parameters excluding parameter ) plus parameter itself: .
To find the standalone contribution of parameter , we calculate the Marginal Contribution by finding the difference between the score with and without :
This value reveals the direction and magnitude of the impact:
- Positive value: Parameter increases the probability of fault (it is a driver of the fault).
- Negative value: Parameter decreases the probability (it argues against that fault).
- Larger magnitude: The more dominant the parameter is in the root cause analysis.
From Marginal Contribution to SHAP Values
For a single parameter, multiple marginal contributions exist because the parameter set can be formed in various combinations.
For example, given four thermodynamic parameters –, when calculating the marginal contribution of , there are 8 possible subsets that do not include : , , , , , , , and . Consequently, has 8 distinct marginal contributions.
The SHAP value is the weighted average of all these marginal contributions:
Where is the total number of parameters and is the size of the subset.
The SHAP value quantifies the importance: the higher the value, the more critical the parameter is for classifying the fault.
Tree SHAP: Accelerating the Calculation
Calculating exact SHAP values is computationally expensive because it requires traversing every possible combination. Tree SHAP solves this by leveraging the hierarchical structure of decision trees. Instead of all combinations, it only calculates contributions along the actual paths a sample takes through the tree, drastically improving efficiency.
Example:
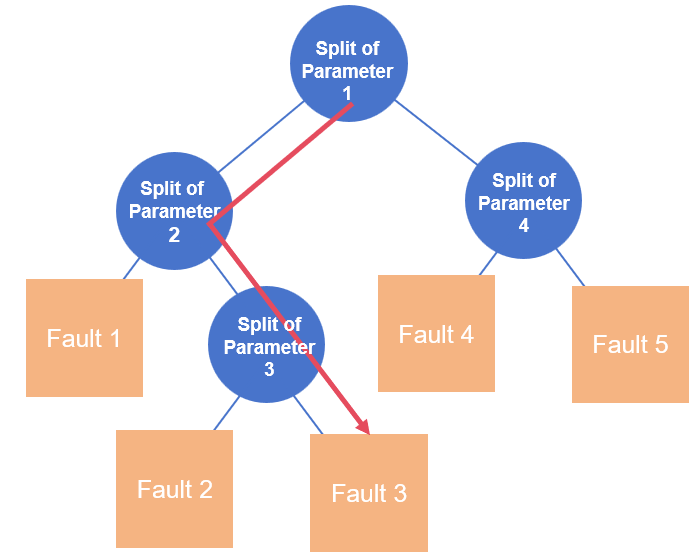
Tree shape Roadmap
In a tree with 4 parameters, if a sample follows the path[P1 → P2 → P3 → Fault 2], Tree SHAP only processes these specific parameters rather than every possible permutation.Explainability Analysis (Case Study: Piston Ring Wear - F4)
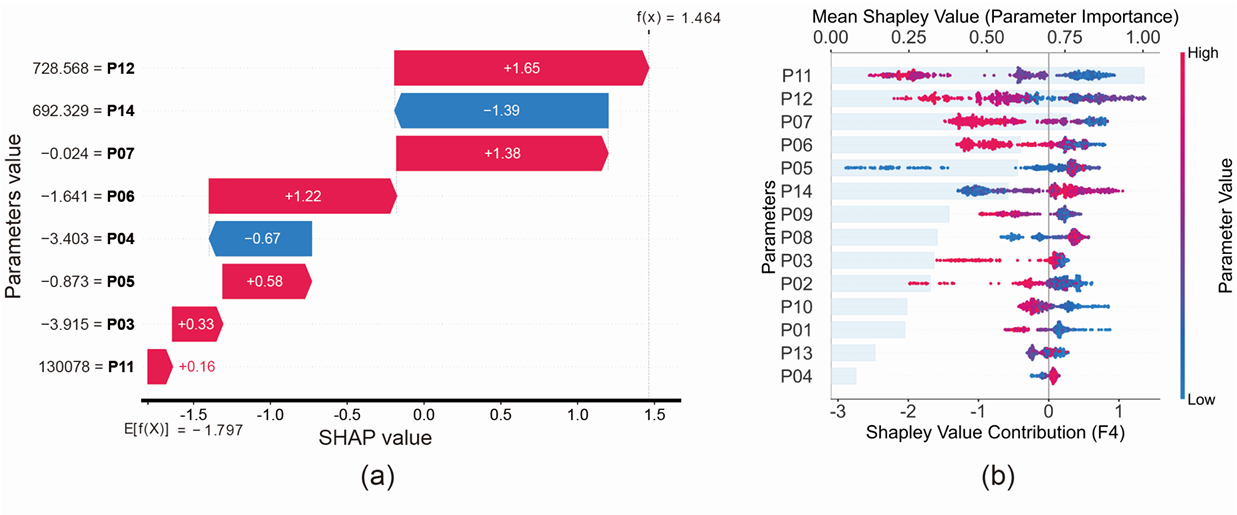 The researchers analyzed Piston Ring Wear (Fault F4) using multi-dimensional SHAP plots,Plot(a) is Waterfall Plot;Plot(b) is Beeswarm Plot。
1. Waterfall Plot(Plot a)
- Purpose: Explains the decision for a single F4 fault sample;
- Logic: Starting from the base value (the average prediction), it adds the SHAP values of each parameter to reach the final score of ;
- Key Finding: Parameters like P12 (Exhaust gas temp before turbo), P6 (Blow-by heat flow), and P14/P7 (Exhaust gas temp after turbo) show the highest absolute SHAP values, identifying them as the primary triggers for this specific case.
2. Beeswarm Plot(Plot b)
- Purpose: Provides a global view of parameter importance across all F4 samples;
- Logic: The y-axis lists parameters; the x-axis shows the SHAP value;
- Key Finding:
- (Exhaust gas pressure before turbo) has the highest average SHAP value;
- Low values of P11 (indicated by color) often fall in the positive SHAP zone, meaning "low P11" is a hallmark of piston ring wear;
- Integrating the physical mechanism: Piston ring wear leads to sealing failure → increased blow-by gas → thermodynamic imbalance in the exhaust system → reduction in P11.
3. Core Conclusion
The study identifies that the root causes of Piston Ring Wear (F4) in marine diesel engines are characterized by:
- Low P11: Exhaust gas pressure before turbocharger.
- Low P12: Exhaust gas temperature before turbocharger.
- Low P7: Exhaust gas temperature after turbocharger.
- High P6: Increased blow-by heat flow.
Original Reference
C. Luo, M. Zhao, X. Fu, S. Zhong, S. Fu, K. Zhang, X. Yu. Thermodynamic simulation-assisted random forest: Towards explainable fault diagnosis of combustion chamber components of marine diesel engines [J]. Measurement, 2025, 251: 117252.